CPU Check - Monitor CPU Usage

CPU Check - Monitor CPU Usage

By Stefan Van Damme

  • Category: Utilities
  • Release Date: 2015-10-20
  • Current Version: 1.0.23
  • Adult Rating: 4+
  • File Size: 862.42 kB
  • Developer: Stefan Van Damme
  • Compatibility: Requires iOS 11.0 or later.

Description

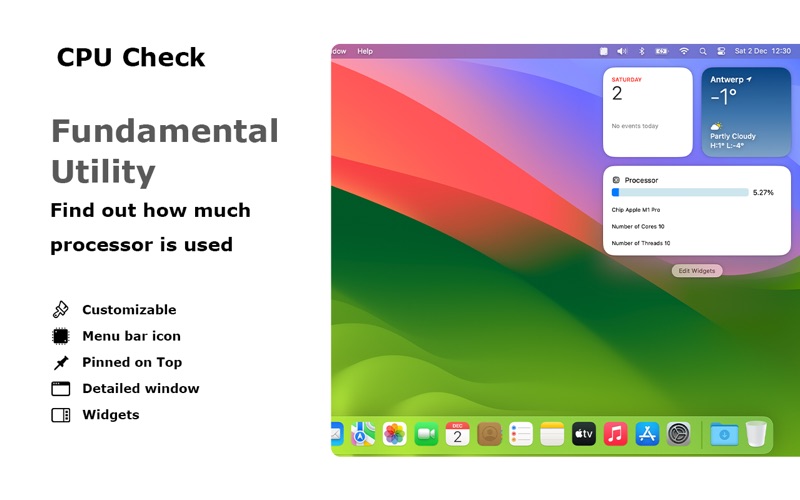
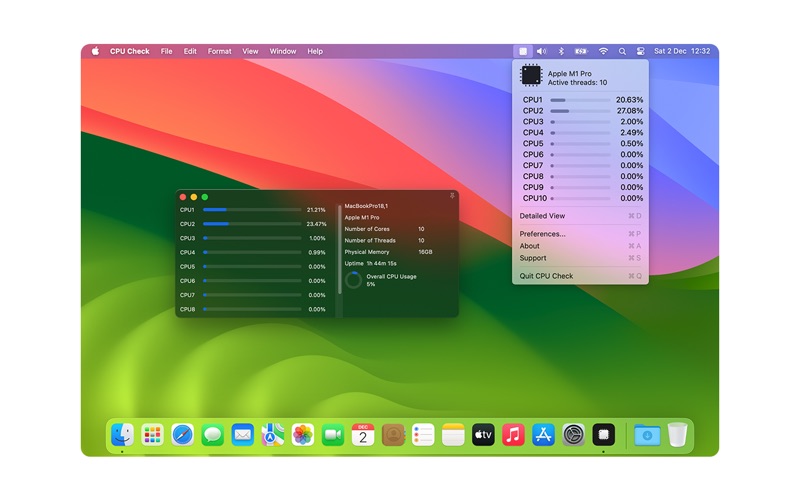
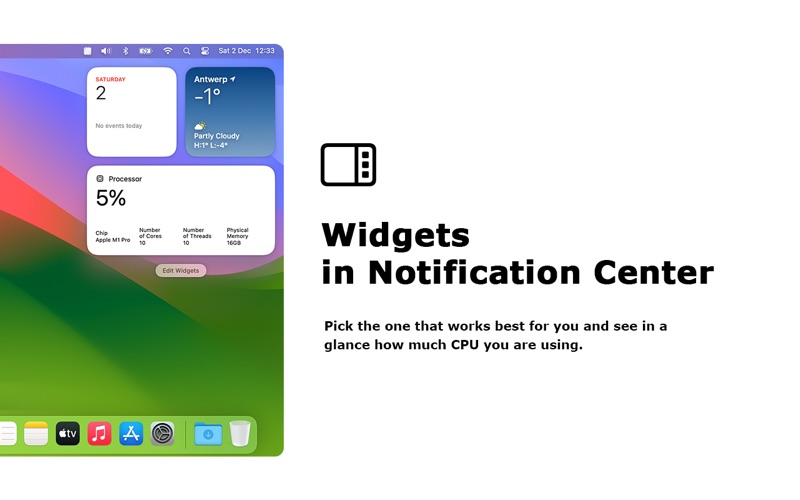
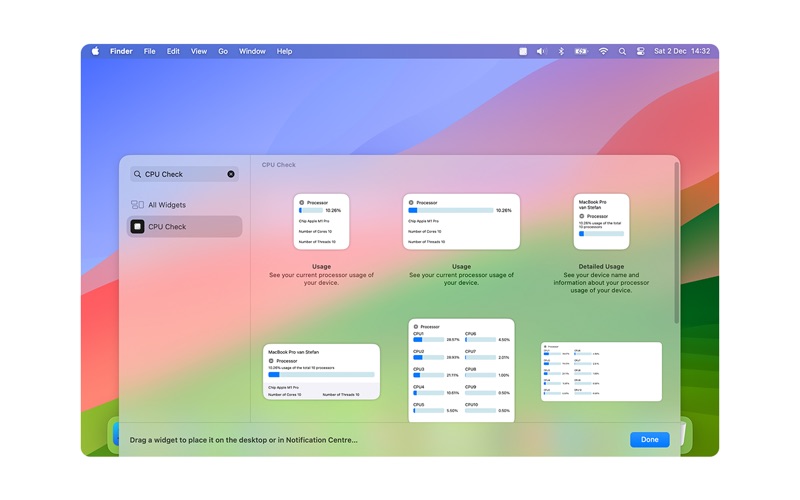
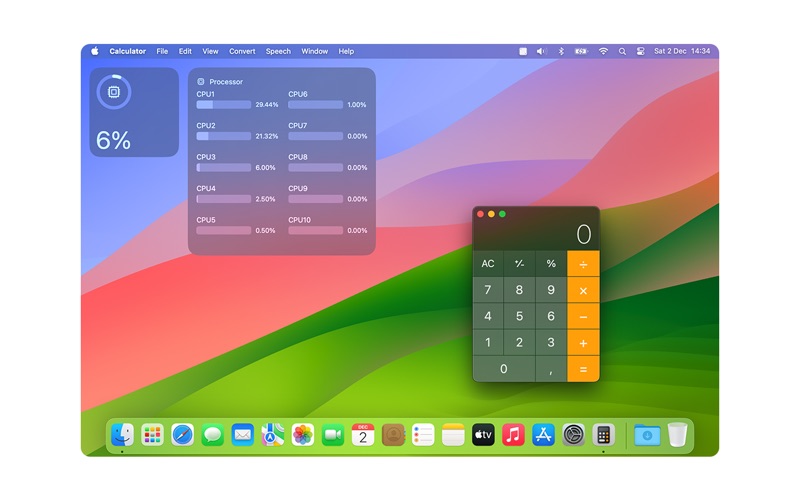
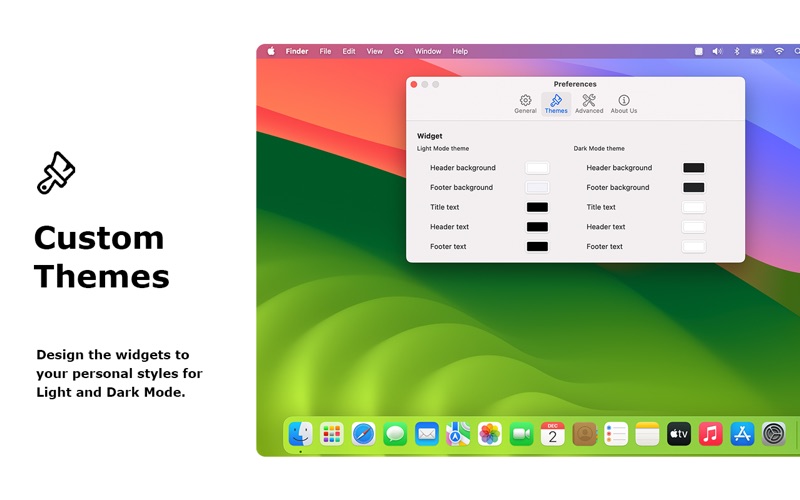
See your total CPU usage at a glance. Now you can see your total CPU usage in the application and also as a widget in your notification panel. The CPU Check app is a handy and informative tool to monitor live all your processors. The widget supports multiple sizes including small, medium, and large. And it supports Light Mode and Dark Mode. How to check CPU usage on Mac? You can choose up to the 9 best widgets you want to see on your screen. From the total processor percentage, a total progress bar, or each processor separately in a progress bar. That is built for MacBook, MacBook Air, MacBook Pro, iMac, iMac Pro, Mac Pro, Mac mini, and Mac Studio. It is the ideal tool for ultimate professionals, photo editors such as Adobe Photoshop or Affinity Photo, musical composition, Logic Pro X producers, 3D designers, industry engineers that do fluid dynamics and aerodynamics analysis with NASA TetrUSS, heavy video editors, Maxon Cinema 4D, Hollywood’s professional editing with Blackmagic DaVinci Resolve Studio, and Final Cut Pro. That uses the latest generation high-end CPUs such as Intel Core i9, Intel Core i7, Intel Core i5, Intel Core i3, and Intel Xeon W processors. And the Apple Silicon Chip which is designed by Apple Inc. that uses the ARM architecture. Such as the Apple M1 chip, Apple M1 Pro chip, Apple M1 Max, and Apple M1 Ultra chip. And also the Apple next-generation System on a Chip (SoC) M2, M3 chip. That gives you incredible performance for pro applications. So what are you waiting for? Get it Now! Mac app features: ◆ See your CPU core (Single-Core, Dual-Core, Quad-Core, 6-Core, 8-Core, 10-Core, 12-Core, 14-Core, 16-Core, 18-Core, 20-Core, 24-Core, 28-Core, 32-Core) ◆ Information about your Mac model type ◆ Get the total memory used in GB ◆ See your current CPU model and frequency ◆ Get the number of performance cores and efficiency cores ◆ Get the number of cores and threads of the processor ◆ Get the startup time in hours, minutes, and seconds ◆ Optional CPU meter (static, process bar, and percentage value) in the Apple menu bar ◆ Option to pin the window on top of your desktop ◆ Option to change the refresh rate ◆ Add widgets on your desktop and Notification Center ◆ Support for Dark Mode The following high-quality widgets are available in this widget bundle: ◆ Shows the progress bar and the label core and threads (in small, and medium sizes) ◆ Detailed Usage of your total processor with the device name on top (in small, medium, large, and extra large sizes) ◆ Percentage number of your all processors (in small, and medium sizes) ◆ Gauge of your total processor (in small size)

Screenshots

Reviews

  • Excells at monitoring CPU overload

    5
    By Geekster2
    It’s good to be able to see if my system is overloaded when doing certain CPU-intensive jobs. It's not good to overheat the computer!
  • Okay

    4
    By pgcrowe
    The app no longer works in the notification center as of OS 11. Also, the app lacks the ability to show processor frequency. iStat Menus integrated support for Intel Power Gadget to show processor frequency values, which is vastly more useful to me than processor use percentage alone. Otherwise, everything else is marvelous.
  • Latest Update Finally Made It Useful Again.

    5
    By kGoreham
    FINAL EDIT: The app now has both a visible scroll bar and a click-and-drag resizable height that fits my number of cores, so I'm happy. –––––––––––––––––––––––––––––––––––––––––––––––– NEW EDIT: Ok, the app finally shows all of my cores again. But it does so through an unintuitive (because there is no scroll bar) scroll view that I'm only able to access using my mouse wheel, that the developer had to tell me about. But what if I didn't have a mouse with a wheel? Why can't I click and drag? What if I want to see ALL of my cores at once (and I do) while analyzing a program's usage of my processor instead of having to scroll back-and-forth through them? The old view of all 20 cores at once was perfect. For five stars, this app needs both a scroll bar, and the ability to click and drag a corner to lengthen or widen the view to include all processors. As for going to the "support page", this page was non-functional. Since it did not provide either an email address, or a simple way to send the developer a message. It demands that I tell it what I need help on first, and I'm not going to waste time with an auto-support rabbit hole in order to send him simple suggestions. (EDIT: It looks as though the program has been updated, but now it only shows 8 cores, not the full 20 that it showed in the update that came after my last review that criticized it for only showing 16. Come on!!!) Simple app that does what it says. My only complaint is that it only shows up to 16 core threads, and I’m running it on my new 10-core (20 thread) iMac Pro. Can we get please a resize option for the app window?
  • Works Like a Champ

    5
    By JimGr
    Simple and to the point. If you want to know how the cores of your CPU are being taxed at certain times, CPU Check will let you know. It’s just like the picture above, works beautifully with the most up-to-date system as of this writing: 10.11.6 (El Capitan). As a Logic Pro X user, it’s good to be able to turn certain things on and off to see what the impact is and how many more processor intensive plug-ins and instruments I might be able to add. I couldn’t be happier with this simple app.

keyboard_arrow_up